|


Creating a Coordinate Plot
Overview
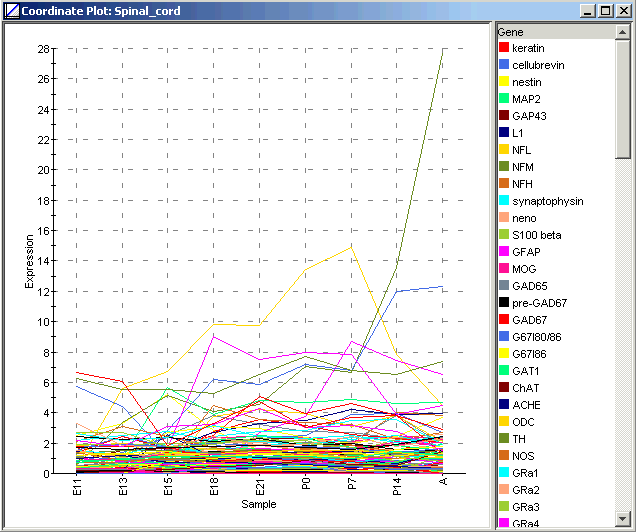
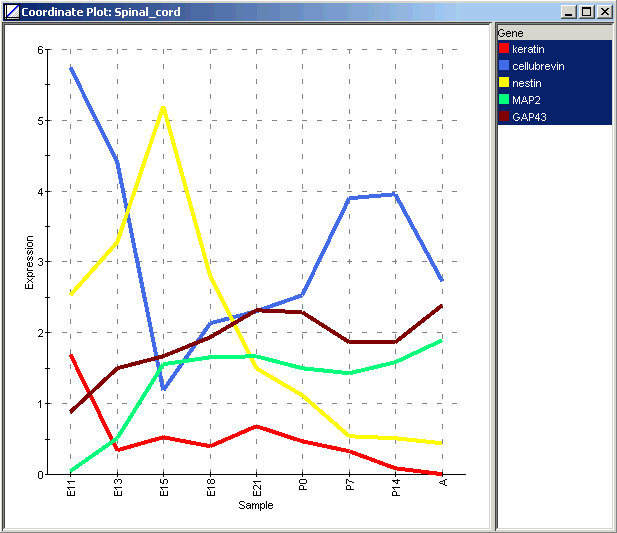
The coordinate plot is used to view the profile of a gene's expression pattern over all samples, or a sample's expression pattern over all genes.
For a large dataset, a coordinate plot of all genes over all samples may be very busy. For more refined behavior, select one or more genes or samples from the table viewer before creating the coordinate plot. In this case only the selected genes or samples are plotted.
Actions
Displaying a Coordinate Plot of All Genes
1. Click a dataset item in the Experiments navigator. The item is highlighted.
2. Select Coordinate Plot from the Explore menu. A coordinate plot of all genes is displayed.
Displaying a Coordinate Plot of Selected Genes or Samples
1. Click a dataset item in the Experiments navigator. The item is highlighted.
2. Click the Table
View toolbar icon ![]() , or select Table
View from the Explore menu,
or right-click the item and select Table
View from the shortcut menu. A table view of the dataset is displayed.
, or select Table
View from the Explore menu,
or right-click the item and select Table
View from the shortcut menu. A table view of the dataset is displayed.
3. Select one or more genes or samples for display:
Selecting a gene or sample: click on a column or row heading. The name is highlighted.
Selecting multiple genes or samples: press and hold the <Ctrl> key and click on column or row headings. The names are highlighted.
Selecting a series of genes or samples: press and hold the <Shift> key and click on column or row names. The names are highlighted.
4. Select Coordinate Plot from the Explore menu. A coordinate plot of the selected gene(s) is displayed.
Interacting With the Plot
Displaying an Expression Value
Plot Functions
Create Gene List from Selection or Cluster
Customizing the Plot
Related Topics: