|
Tutorial 5: Step 5 Display a Loadings Color Matrix Plot
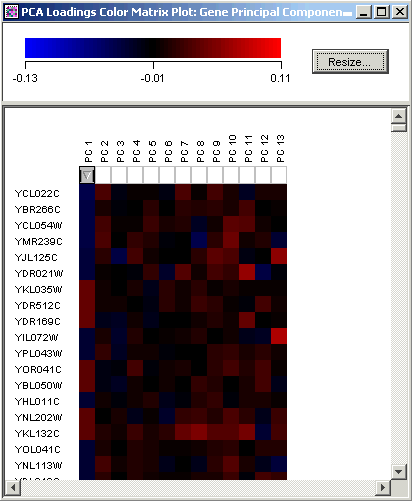
To get a finer resolution of the coefficients, it can be more effective to look at a Loadings Color Matrix Plot. These represent exactly the same numbers that were in the Loadings Line Plot, but they are displayed in a way that is easier to interpret when large numbers of variables are present.
Display a Loadings Color Matrix Plot
1. If the PCA:genes item in the Experiments navigator is not already highlighted, click it.
2. Click the Loadings
Color Matrix Plot toolbar icon ![]() , or select Loadings Color
Matrix Plot from the PCA menu,
or right-click the item and select Loadings
Color Matrix Plot from the shortcut menu. A loadings color matrix
plot of the PCA results is displayed.
, or select Loadings Color
Matrix Plot from the PCA menu,
or right-click the item and select Loadings
Color Matrix Plot from the shortcut menu. A loadings color matrix
plot of the PCA results is displayed.
Note: This plot initially displays genesí or samplesí rows in descending numerical order as established by the loadings on the first principal component (PC1). You can change the display order of rows by clicking the respective up/down arrow at the top of each PC column in the color matrix. For each PC, you may choose to sort the genes in descending order of absolute value, simple descending order, or ascending order. This allows you to identify easily genes which are most strongly correlated or anti-correlated with the first principal component, for example.

3. To see more gene components at once, click Resize and move the Height slider to the far left (minimum).

