|
Performing a SOM Experiment
Overview
This procedure explains how to create a SOM experiment for a dataset. The results of this experiment can be visualized in various types of plots to provide you with additional data mining information.
Actions
1. Click a dataset in the Experiments navigator. The item is highlighted.
2. Click the Self-Organizing
Map toolbar icon ![]() ,or select Self-Organizing
Map from the Clustering menu,
or right-click the item and select Self-Organizing
Map from the shortcut menu. The Self-Organizing
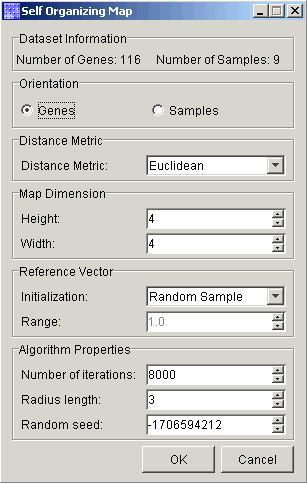
Map parameters dialog is displayed.
,or select Self-Organizing
Map from the Clustering menu,
or right-click the item and select Self-Organizing
Map from the shortcut menu. The Self-Organizing
Map parameters dialog is displayed.

3. Set the dialog parameters.
|
Parameter |
Description |
|
Orientation |
This indicates whether to cluster samples or genes. The default is Genes. |
|
Distance Metric |
This indicates which metric to use to determine distances. The default is Euclidean. Other options are Manhattan, Pearson Correlation, Pearson Squared, Euclidean Squared, and Chebychev. |
|
Height |
This indicates how many nodes high the map shall be. The default height is 4. |
|
Width |
This indicates how many nodes wide the map shall be. The default width is 4. |
|
Initialization |
Method to initialize the reference vectors of the nodes. It can be set to Random Sample (default) or Random Value. Random sample refers to the assignment of randomly selected items (genes/samples) from the dataset to be the initial reference vectors of the map. |
|
Range |
If the reference vectors are initialized by Random Values, then Range sets the bounds on random values, where values are chosen from the real number range [-value_range, value_range]. The default is 1. |
|
Number of iterations |
Indicates the number of iterations to perform on the SOM. During each iteration, the SOM learns from one item (sample or gene). This must be an integer greater than zero. A good rule-of-thumb is to use the number of cluster items or 500 times the number of nodes, whichever is greater. The default is 8000 to match the default map size (4*4*500 =8000). |
|
Radius length |
This is an integer that indicates the initial area on the map that can be affected during an iteration of learning (i.e. the bubble neighborhood). The unit of measure is the number of nodes. The default is 3. |
|
Random seed |
This is an integer value that indicates the random seed used by the SOM algorithm, and allows you to perform repeatable experiments. The default is a random number. |
4. Click OK. The Experiment Progress dialog is displayed. It is dynamically updated as the SOM operation is performed. To cancel the SOM operation, click the Cancel button.

Upon successful completion, a new SOM item is added under the original item in the Experiments navigator.
Plotting a SOM Experiment:
Related Topics:
Overview of Self-Organizing Maps (SOMs)
Tutorial 4: Self-Organizing Maps

