|
Platinum
Tutorial 7: Step 5 Display IBIS Gradient Plot
Actions
1. Click the top gene (AA046755) in the IBIS Search Results Viewer. The gene is highlighted.
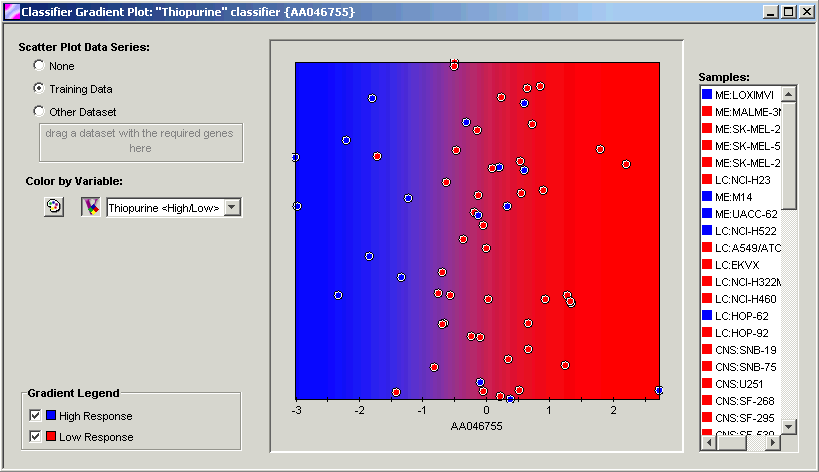
2. Click Gradient Plot. The Classifier Gradient Plot is displayed.

Discussion
In this plot, we see three areas. The most important area for now is the scatter plot in the center.
The left-right position of each point on the plot represents the expression level of gene AA046755 in one of the 60 cell lines. Because this is 1D IBIS, only one dimension of the plot is meaningful: The horizontal axis. The height of each point is assigned randomly to minimize visual overlap, so be careful not to impute any meaning to the vertical position of the points.
Each point is colored according to the cell line’s observed response to thiopurine, as shown in the legend at the bottom left. The background of the scatter plot is a color gradient that corresponds to the IBIS classifier’s prediction, in the same basic color scheme as the point coloring. We can see which samples are incorrectly classified by comparing the color of the points to the color of the background. We can see that down-regulation of AA046755 (negative values) occur more frequently with high response to thiopurine. The line where high response crosses over to low response – where blue crosses over to red – is at about a log ratio of -1.
When we imagine the complexity of a cell’s response to a treatment, it is unsurprising that we cannot achieve perfect separation using a single gene and a linear classifier. IBIS allows you to explore relationships between pairs of genes, and to use non-linear classifiers to identify patterns.

