|
Platinum
Tutorial 7: Step 4 View IBIS LDA Search Results
Overview
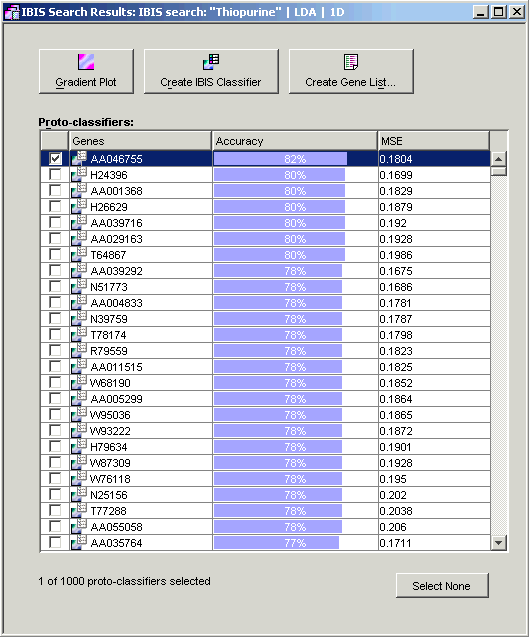
The IBIS Search Results Viewer consists of a 3-column listing. The first column contains gene identifiers, the second contains MSE values, and the third contains accuracy figures. The results are initially sorted by the accuracy values. Both the MSE and accuracy values are indications of the ability of the classifier (gene) to separate the inhibited cell lines form the uninhibited cell lines, given the treatment of Compound A. The MSE values reflect the level to which the data matched the linear model, with lower values being better, while the accuracy values reflect the predictive accuracy of a linear model in separating the inhibited from uninhibited cell lines. When comparing two genes that have the same accuracy value, the one with the lower MSE is generally to be preferred.
Actions
If the IBIS Search Results Viewer is already displayed, skip to #2 below the image.
1. Double-click the Thiopurine IBIS search LDA 1D item in the Experiments navigator (or click the item and select IBIS Search Results from the Predict menu). The item is highlighted and the IBIS Search Results Viewer is displayed .

2. Click the MSE column header. The genes or proto-classifiers are re-sorted according to their mean-squared error.
3. Click the Accuracy header. The genes are once again sorted by their accuracy as classifiers.
Discussion
The IBIS Search Results Viewer has three columns of information. The first column contains gene identifiers, the second contains cross-validation accuracy scores, and the third contains mean squared error (MSE) values. The results are initially sorted by accuracy. Both the MSE and accuracy values are indications of the ability of the classifier (gene) to separate the high-response samples (cell lines) from the low response samples. The MSE values reflect how well the data match the linear model, with lower values being better. Accuracy values reflect the predictive accuracy of a linear model in separating the high responses from low responses.
When comparing two genes that have the same accuracy value, the one with the lower MSE is generally to be preferred. You will find, though, that accuracy and MSE tend to be highly correlated, a high accuracy generally indicating a low MSE and vice versa.
Let us examine the top gene AA046755, which has an accuracy of 82% and an MSE of 0.18. We will display the actual gene expression measurements for this gene superimposed on the output of the IBIS linear classifier to get a sense of which samples are correctly and incorrectly classified.

