|
Tutorial 1: Step 7 Create a Centroid Plot
Create a Centroid Plot
1. If the partitional clustering item in the Experiments navigator is not already highlighted, click it.
2. Select Centroid Plot from the Clustering menu, or right-click the item and select Centroid Plot from the shortcut menu. A centroid plot of the dataset is displayed.

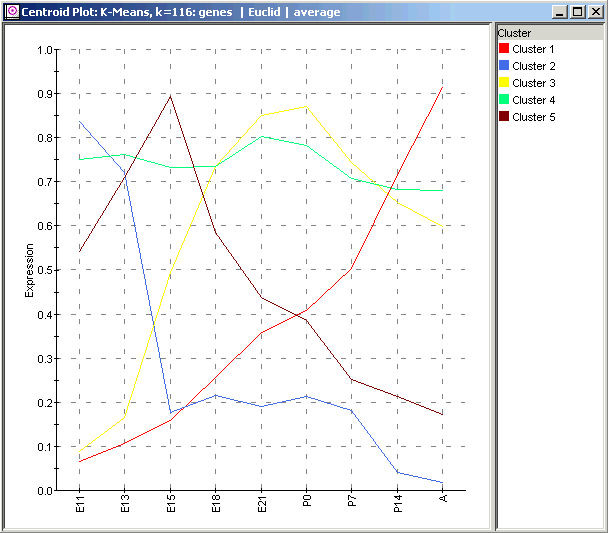
The Centroid Plot is so named because each line represents the centroid or average element of a cluster. It is conceptually identical to the average waves plotted in Figure 3a of Wen et al. You should be able to see a clear visual resemblance between the clusters shown here, the clusters you just computed, and Wen’s clusters. Comparing just the figure above with Wen, note the following:
A ‘constant’ cluster (4);
a cluster (2) with an early maximum, similar to Wen’s Wave 1;
a cluster (1) with a maximum at the 'A' (adult) timepoint, similar to Wen’s Wave 4, and
two other clusters (3 and 5) with maxima at intermediate timepoints.
The Centroid Plot: Variability in K-Means Clustering
The colors and the cluster numbering in your Centroid Plot will probably be different from the above image, since clusters are arbitrarily labeled and colored.
More importantly, though, the line shapes will probably be slightly different. An important point about K-Means clustering is there is a random element in it. K-Means first randomly allocates items to clusters, and then systematically moves one item at a time from cluster to cluster in such a way as to minimize distances within clusters and maximize distances between clusters. However, there is no guarantee that all random starting allocations will lead to the same final clustering, only that the final clustering will have reasonably low intracluster distances compared to the inter-cluster distances.
This can be viewed as the cost of obtaining clusters quickly, but you can also look at it as a tool to show how meaningful your clusters are. If you rerun K-Means clustering a few times and get wildly different results, your data probably does not have any significant natural divisions, and you should probably not read anything into the clusters it produces. Conversely, if you rerun K-Means clustering twice and get similar results, the corresponding clusters are probably well-separated and meaningful.
For more information on clustering, refer to Clustering Overview.

