|


Overview of Lowess Normalization
Overview
In experiments where two fluorescent dyes (red and green) have been used, intensity-dependent variation in dye bias may introduce spurious variations in the collected data. Lowess normalization merges two-color data, applying a smoothing adjustment that removes such variation.
Lowess Normalization Characteristics
Lowess normalization may be applied to a two-color array expression dataset.
All samples in the dataset are corrected independently.
Lowess normalization can be applied to complete or incomplete datasets. If either the red or green intensity value is missing for a certain gene, there will be a missing value at the corresponding position in the log-ratio table which is generated.
Lowess Normalization Method
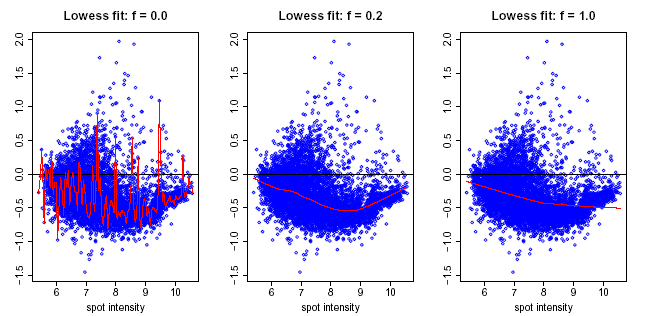
Lowess normalization assumes that the dye bias appears to be dependent on spot intensity. The adjusted ratio is computed by:
log(R/G) -> log(R/G) – c(A)
where c(A) is the Lowess fit to the log(R/G) vs log(sqrt(R*G)) plot.
If green has been chosen as the treatment dye and red as the control dye, then R and G are reversed in the above formula. Treatment and control dyes are designated when the data is imported into GeneLinker™.
Lowess regression, or locally weighted least squares regression, is a technique for fitting a smoothing curve to a dataset. The degree of smoothing is determined by the window width parameter. A larger window width results in a smoother curve, a smaller window results in more local variation.
Upon successful completion of the normalization, a new dataset with the Lowess-corrected (R/G) values (or (G/R) if appropriate) is stored in the repository and is added to the Experiments navigator. The result is a dataset of corrected ratios (not log ratios).
Reference
Y. H. Yang, S. Dudoit, P. Luu and T. P. Speed. Normalization for cDNA Microarray Data. SPIE BiOS 2001, San Jose, California, January 2001.
Related Topics:
Subtraction of Central Tendency