|


Creating a Loadings Line Plot
Overview
The Loadings Line Plot is one of three closely related plots (Loadings Line Plot, Loadings Scatter Plot, and Loadings Color Matrix Plot) that displays the individual elements of the PCs. (Since a PC is a vector, it has constituent elements which are called the coefficients or loadings. By mathematical definition of PC adopted by GeneLinker™, the Euclidean norm, i.e., vector length, of each PC is 1.) The loadings of a given PC represent the relative extent to which the original 'variables' (Genes or Samples, depending on the Orientation selected for the PCA) influence the PC. The Loadings Line Plot displays these loadings of a particular PC as a connected line graph.
The coefficients or component loadings can be interpreted as the derived relative weightings of the original 'variables' (Genes or Samples, depending on selected Orientation) in the derived linear combination that constitutes each PC. Thus, the coefficients or component loadings express the relative weights of association between the original 'variables' (Genes or Samples) and the computed PCs.
The Loadings Line Plot x axis shows the original 'variables' (e.g., Genes) in the same order in which they appear in the dataset from which the PCs were derived. The y axis shows the numerical values of the loadings. GeneLinker™ assumes the original measurements reflect gene expression levels; hence, the y axis label is ‘Loading’ regardless of which normalizations may have been performed in producing the dataset upon which the PCA was performed. The y axis ranges across a continuum restricted between -1 and 1, by mathematical definition of PCs (i.e., PCs form an orthonormal basis).
Note that the maximum number of Principal Components (PCs) to display is set in Preferences under the Edit menu. This only applies to what is displayed in the Scree Plot and the Loadings Line Plot. This setting does not affect the actual calculation of the PCs. It solely sets an upper limit on the number of PC's to display in these two plots; therefore it does not have to be set before the PCs are calculated.
GeneLinker™ also limits the number of PCs by their contribution towards representing fractions of the total variance of the date (i.e., their numerical relevance). Only PCs associated with respective eigenvalues greater than or equal to 1E-8 are included in the calculation result set. But in practice, PCs with respective eigenvalues (i.e., fractions of data total variance) less than about 0.1, are rarely of much interpretive use or value.
Note also that a PC's pointing direction (e.g., southeast rather than northwest) along the line co-linear with the PC is irrelevant. Therefore, reversing the algebraic signs of all the constituent values of a PC in, for example, a Loadings Line Plot, is irrelevant.
If you choose the same principal component for both axes, the points may fall outside the unit circle.
Actions
1. Click a PCA Experiment in the Experiments navigator. The item is highlighted.
2. Select Loadings Line Plot from the PCA menu, or right-click the item and select Loadings Line Plot from the shortcut menu. The PCA Loadings Line Plot is displayed:
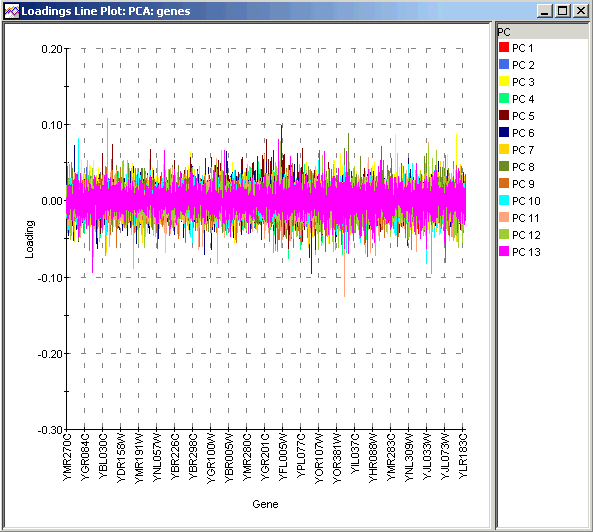
A Loadings Line Plot allows you too see the relative influence of Genes (if PCA by Genes) or Samples (if PCA by Samples) on the PCs. The numerical values can be interrogated by selecting individual curves for clarity and viewing tooltips. Because the maximum possible range for loadings is the same for all PCs (-1 to 1), it makes comparisons of loadings commensurable. Thus, you could compare, for example, the loading for a given gene on the x axis across each PC as well as compare different genes among one another in their respective contributions to a given PC. In some contexts where the Genes or Samples have been pre-sorted or clustered into meaningful groups, it is possible to identify which groups are most heavily represented in each PC. This can help to identify good PCs for separating gene or sample classes.
Plot Operations
Related Topics:
Overview of Principal Component Analysis (PCA) Functionality
Tutorial 5: Principal Component Analysis (PCA)