|
Tutorial 8: Step 12 Display 3D Score Plot
If the 3D Score Plot is already displayed, skip to #2.
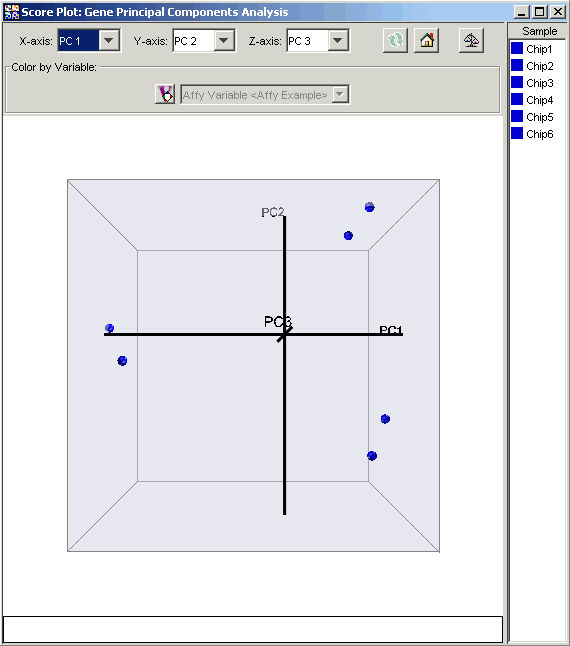
1. Double-click the PCA: genes experiment in the Experiments navigator. The item is highlighted and a 3D score plot is displayed.

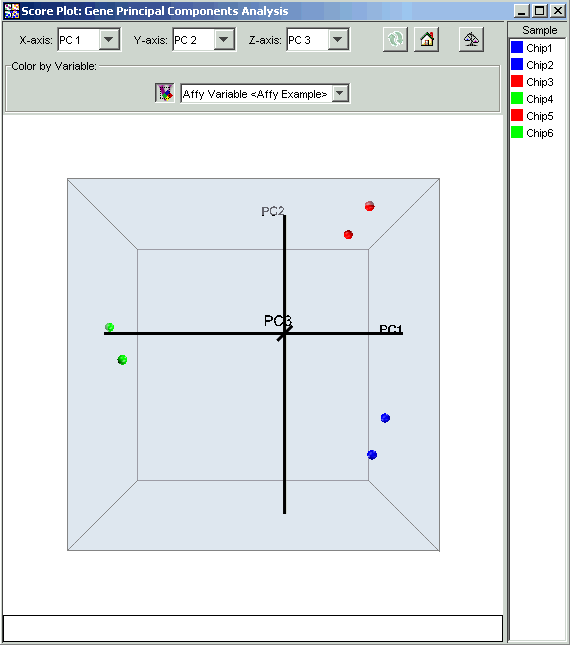
2. Click the Color by Variable button. The points on the plot are colored by their respective classes.


