|
Tutorial 8: Step 10 Display Matrix Tree Plot
If the matrix tree plot is already displayed, skip to #2.
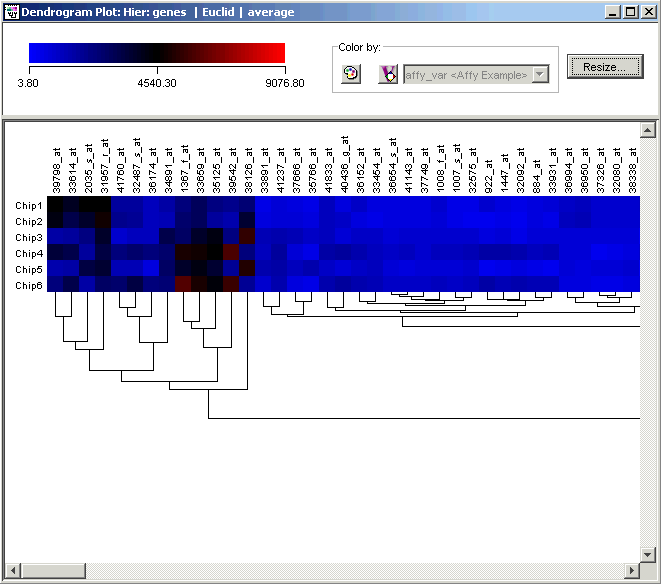
1. Double-click the Hier: genes | Euclid | average experiment in the Experiments navigator. The item is highlighted and a matrix tree plot is displayed.

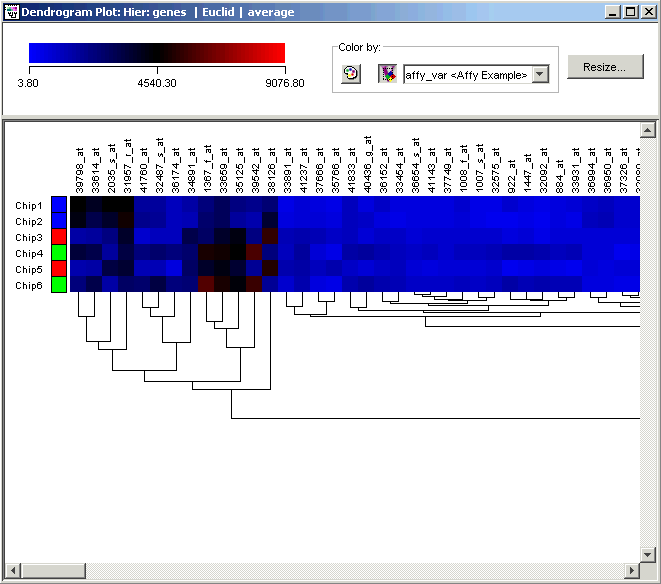
2. Click the Color
by Variable button ![]() . Blocks of color are displayed
to the right of the sample names colored according to the class of each
sample.
. Blocks of color are displayed
to the right of the sample names colored according to the class of each
sample.

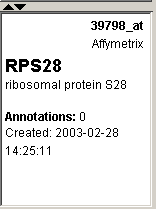
3. Click the first gene on the plot. The gene is highlighted. Look at the Description Pane. Information about the gene is displayed.

4. Click the ![]() icon in the upper right
corner of the plot to close it.
icon in the upper right
corner of the plot to close it.

