|
Platinum
Tutorial 7: Step 8 Display IBIS Gradient Plot
Overview
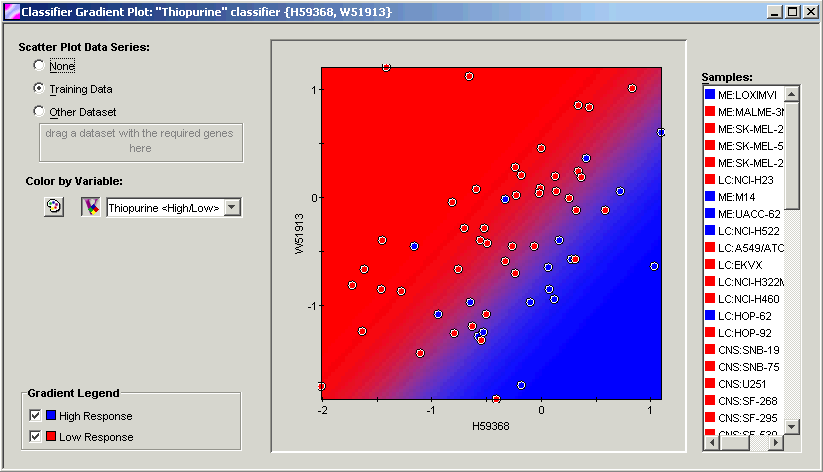
This plot is similar to the one shown for the 1D LDA results, except that now two genes are used in the scatter plot. The vertical dimension signifies the expression level of one of the genes, rather than random jitter. Furthermore the gradient behind the scatter plot now reflects the two dimensional nature of the classification pattern. We shall examine a gene pair with an easily interpreted pattern.
Actions
1. Click the MSE column header in the IBIS Results Viewer. The search results are sorted by mean square error.
2. Click the top item, the gene pair H59368 and W51913 with accuracy 78% and MSE 0.1657. The item is highlighted.
3. Click Gradient Plot. The IBIS Gradient Plot is displayed.

Discussion
This gene pair depicts an AND relationship: If basal expression of W51913 is low AND basal expression of H59368 is high, then response to thiopurine tends to be high (blue). This rule has 78% accuracy, determined by leave-one-out cross-validation which was the result of setting the number of committees equal to the number of samples. Furthermore, since the genes involved were not individual predictors with >67% accuracy, the predictive power of this relationship is at least partly a combinatorial effect: One cannot get the same result by considering the genes independent of one another.

