|
Tutorial 3A: Step 3 Create a Matrix Tree Plot
If the matrix tree plot is already displayed, there is no need to recreate it. Read the sections below the image for information about the plot.
Create a Matrix Tree Plot
1. Double-click the J-P (6,2): genes | Euclid | average experiment in the Experiments navigator . The item is highlighted and a matrix tree plot is displayed.
OR
1. If the J-P (6,2): genes | Euclid | average experiment in the Experiments navigator is not already highlighted, click it.
2. Click the Matrix
Tree Plot toolbar icon ![]() , or select Matrix
Tree Plot from the Clustering
menu, or right-click and select Matrix
Tree Plot from the shortcut menu. A matrix tree plot of the experiment
is displayed.
, or select Matrix
Tree Plot from the Clustering
menu, or right-click and select Matrix
Tree Plot from the shortcut menu. A matrix tree plot of the experiment
is displayed.

Scroll the Matrix Tree Plot
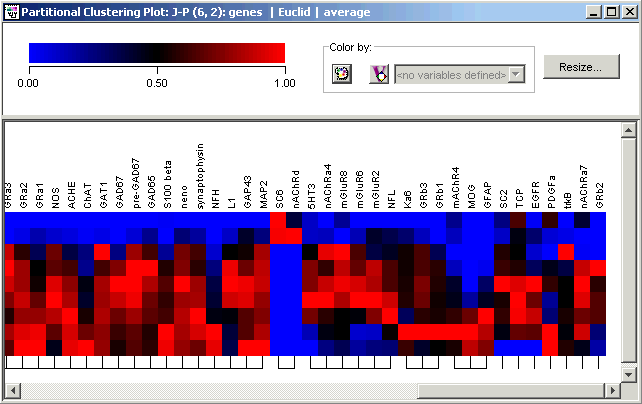
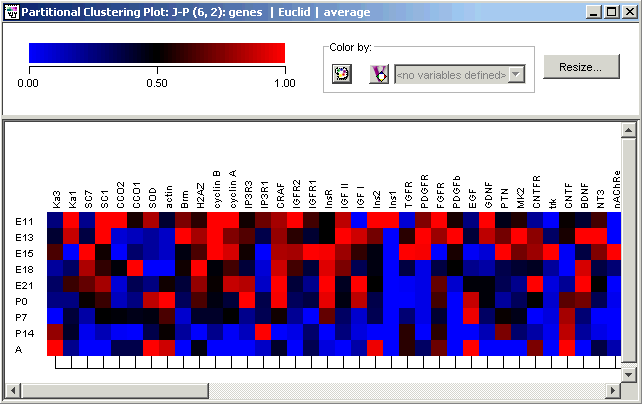
1. Use the bottom scrollbar to scroll to the far right of the plot. The 'comb' under the grid of color tiles illustrate cluster membership.
At the far right of the Matrix Tree Plot are seven singleton genes including SC2, EGFR and trkB, which were also nominated as outliers by Wen et al. using FITCH clustering and a divide-by-max normalization.
Just to the left of that you can see four very tight clusters: three characterized by late expression maxima, and one (SC6 and nAChRd) by an early expression maximum. These are shown in the figure just above.
Three groups to the left of the singletons is a cluster of six genes including three mGlu receptors, all highly expressed in the late embryo and perinatal timepoints.
Two groups to the left of that is a large cluster (41 genes) including a large number of neurotransmitter receptors: three of four serotonin (5HT) receptors; three acetylcholine receptors (plus acetylcholinesterase); NMDA1/2B/2C; mGluR3/4/5/7; GABA receptors GRa1/2/3/4/5 and GRg1/2/3. This cluster's expression profiles are characterized by minimal expression in the E11 and E13 timepoints, followed by fairly uniform expression thereafter.
2. Use the bottom scrollbar to scroll back to the left of the plot.

At the far left is a second large cluster (47 genes) covering a wide variety of genes.

