|
Tutorial 2: Step 9 Color Samples by Class
To Color the Samples by Class
We will need to refresh the Matrix Tree Plot in order to view the new class variable on it.
1. Close all the open plots by selecting Close All from the Window menu.
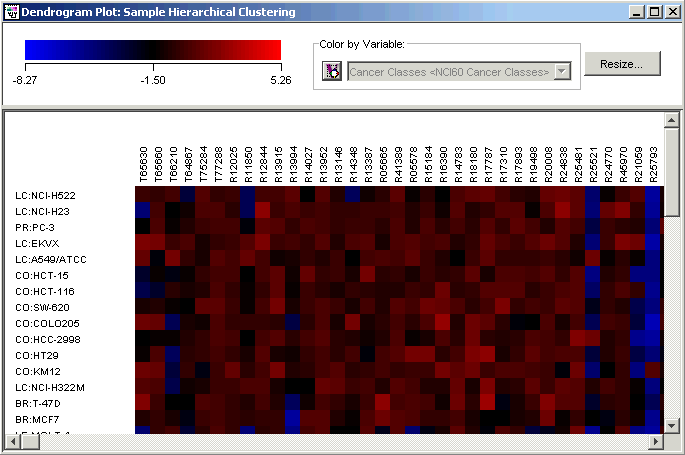
2. Double-click the Sample Hierarchical Clustering experiment in the Experiments navigator. The item is highlighted and a new matrix tree plot is displayed.

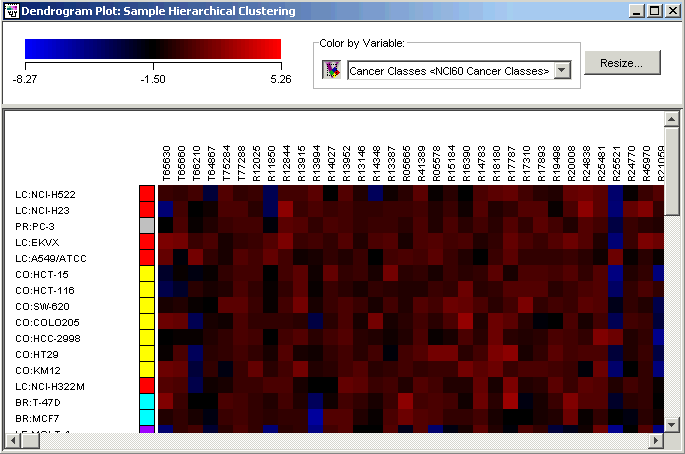
3. Click the Color by Variable button at the top of the plot. A block of color appears to the left of each row indicating which cancer class that sample belongs to. This makes it easy to compare a sample clustering to known classes.

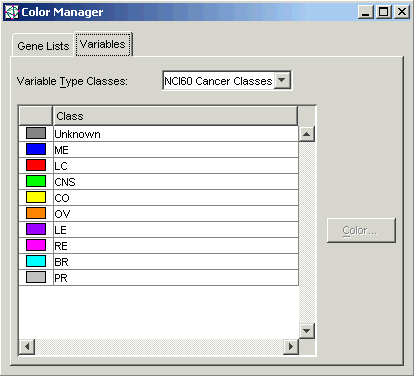
4. To see the key of colors, click the Color Manager button on the plot, or select Color Manager from the Tools menu. The Color Manager dialog is displayed.

5. On the Color Manager dialog, click the Variables tab. The Variables pane is displayed.
6. Ensure NCI60 Cancer Classes is selected in the Variable Type Classes drop-down list.
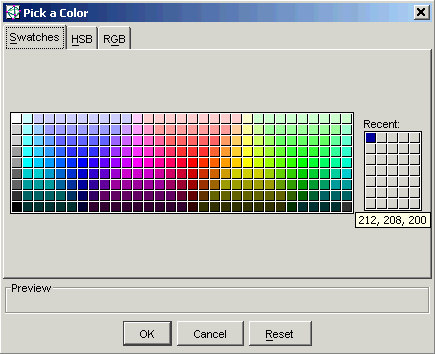
7. You can change the color mapped to any class using the Color Manager. Click the color box to the left of the ME class. The Pick a Color dialog is displayed.

8. Click a dark blue color swatch. You can choose colors from swatches, or by their HSV (hue, saturation, and value) or RGB (red, green, blue) descriptions. The color is displayed in the Recent list.
9. Click OK. The dialog closes and the new color is applied to the ME class on the matrix tree plot.
10. Click the ![]() icon in the upper right
corner of the Color Manager to
close it.
icon in the upper right
corner of the Color Manager to
close it.

