|
Platinum
Classification Plot Training Results
Overview
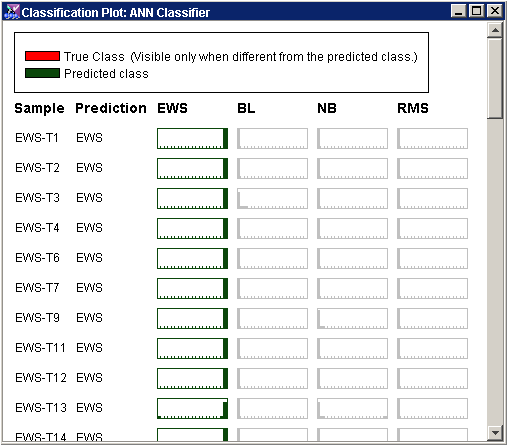
The Classification plot can be used to display the results of training a classifier .
Description
At the top of the viewer is the legend. Dark green is the color of the predicted class and red is the color of a true class.
Each row (sample) has:
Sample name;
Prediction (predicted class);
Class boxes showing the distribution of the votes for each of the possible classes.
A box that is highlighted in dark green is the predicted class for that sample.
A box that is highlighted in red is the true class of that sample as specified in the training classes dataset.
Actions
1. Click a Trained Classifier item in the Experiments navigator. The item is highlighted.
2. Select Classification Plot from the Predict menu, or right-click the item and select Classification Plot from the shortcut menu. A Classification plot of the training results is displayed.

Interpretation
The class of a training sample (that has a true class) that has a dark green box and no red box has been predicted correctly.
The class of a training sample that has a dark green box and a red box has been predicted incorrectly.
If no prediction has been made for a sample, it will have no class listed under prediction and no dark green box.
If a training sample has no true class, it will not have a red box.
Related Topics:

