|
Tutorial 4: Step 9 Create a SOM Plot
If the SOM Plot is already displayed, there is no need to recreate it. Read below the image for information about the plot.
Create a SOM Plot
1. Double-click the SOM: samples | 2x2 | Pearson experiment in the Experiments navigator. The item is highlighted and a SOM plot of the selected item is displayed.
OR
1. If the SOM: samples | 2x2 | Pearson experiment in the Experiments navigator is not already highlighted, click it.
2. Select SOM Plot from the Clustering menu, or right-click the item and select SOM Plot from the shortcut menu. A SOM plot of the selected item is displayed.

A Tour of the Plot
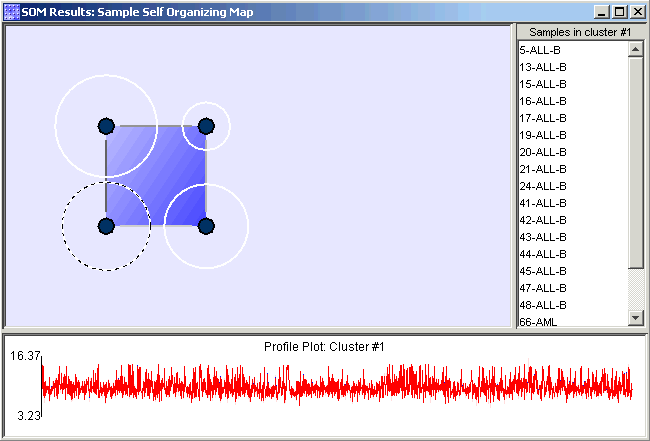
The 'architecture' of the SOM, which you input as Height and Width values in the example above, forms the heart of the plot. Each node of the SOM is depicted as a small solid circle. These are arranged in an array, in this case, of 4 nodes (= 2x2).
Each node is also surrounded by an open circle of varying size. The radius of this open circle indicates the number of cluster items associated with each node (e.g. the number of samples, if you clustered samples).
Hover the mouse pointer over the node for about 2 seconds. A tooltip appears showing the number of items in that cluster, and the cluster name (e.g. 'Cluster #1').
Click on one of the gray circles to select that cluster.
In the right-hand pane is the list of items in the selected cluster, and in the lower pane is a characteristic profile of that cluster.
Similarity Between Nodes
Each node in a SOM is defined by its reference vector, and the similarity or distance between these reference vectors is part of the plot. This similarity is represented two ways:
1. By the coloration of the background behind the array of nodes.
2. By the lines linking adjacent nodes.
By default, the background color scheme uses dark blue to represent high similarity and white to indicate low similarity. Thus groups of similar nodes can be recognized as dark blue areas separated by light blue areas. Conversely, the lines linking adjacent nodes are colored light to represent high similarity, and dark to represent low similarity, so they should stand out against the background.
If you forget this convention, you can look up the significance of the color scheme by right-clicking anywhere in the main SOM display and choosing Customize from the shortcut menu.
You can see that in our example the most similar pair of neighboring nodes is the pair at the bottom, Clusters #1 and #2.
Click on Cluster #4 (the upper right node) to see what samples cluster there. From the sample names shown in the right-hand pane of the SOM display, you can see that this cluster is composed entirely of ALL samples drawn from T cells. Cluster #3 to its left is purely composed of AML samples, while Clusters #1 and #2 are principally made up of ALL samples from B cells - as might be expected from their high similarity mentioned above.
Node Membership
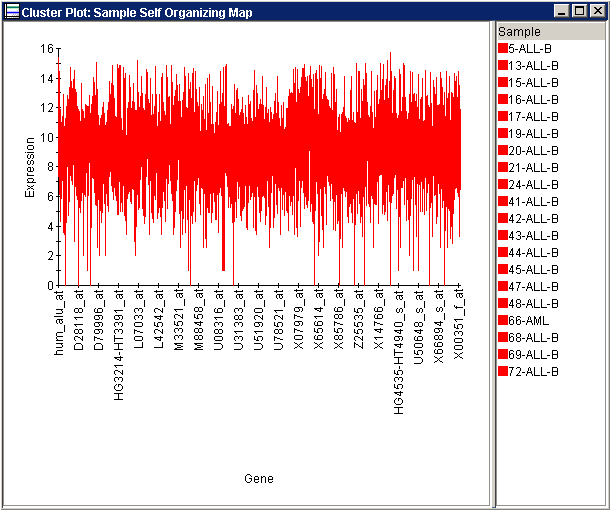
Display a line graph showing all the items in the cluster by clicking a node and selecting Cluster Plot from the Clustering menu, or by right-clicking a node and selecting Cluster Plot from the shortcut menu.


