|
Tutorial 4: Step 7 Display Summary Statistics
Display Summary Statistics
1. If the Norm: log2 dataset in the Experiments navigator is not already highlighted, click it.
2. Click the Summary
Statistics icon ![]() , or select Summary
Statistics from the Statistics
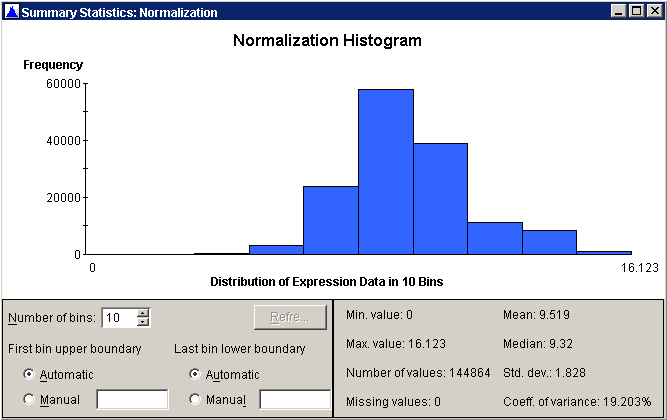
menu. The Summary Statistics chart is displayed.
, or select Summary
Statistics from the Statistics
menu. The Summary Statistics chart is displayed.

3. The Summary Statistics chart shows an approximately normal distribution reflecting the roughly log-normal shape of the normalized data.

