|
Pearson Correlation and Pearson Squared
Overview
Pearson Correlation
Pearson Correlation measures the similarity in shape between two profiles. The formula for the Pearson Correlation distance is:
d = 1 - r
where
r = Z(x)·Z(y)/n
is the dot product of the z-scores of the vectors x and y. The z-score of x is constructed by subtracting from x its mean and dividing by its standard deviation.
Pearson Squared
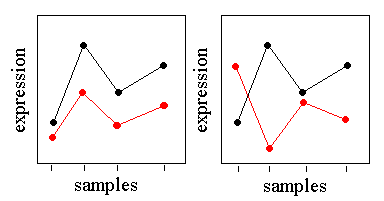
The Pearson Squared distance measures the similarity in shape between two profiles, but can also capture inverse relationships. For example, consider the following gene profiles:

In the figure on the left, the black profile and the red profile have almost perfect Pearson correlation despite the differences in basal expression level and scale. These genes would cluster together with either Pearson Correlation or Pearson Squared distance. In the figure on the right, the black and red profiles are almost perfectly anti-correlated. These genes would be placed in remote clusters using Pearson Correlation, but would be put in the same cluster using Pearson Squared.
The formula for the Pearson Squared distance is
d = 1 – 2r
where r is the Pearson correlation defined above.
Warning: While most combinations of clustering algorithm and distance metrics provide meaningful results, there are a few combinations that are difficult to interpret. In particular, combining K-Means clustering with the Pearson Squared distance metric can lead to non-intuitive centroid plots since the centroid represents the mean of the cluster and Pearson Squared can group anti-correlated objects. In these cases, visually drilling into clusters to see the individual members through the use of Cluster Plots produce better results. Alternatively, the results of the clustering run can be visualized using the Matrix Tree Plot.
Related Topics:

